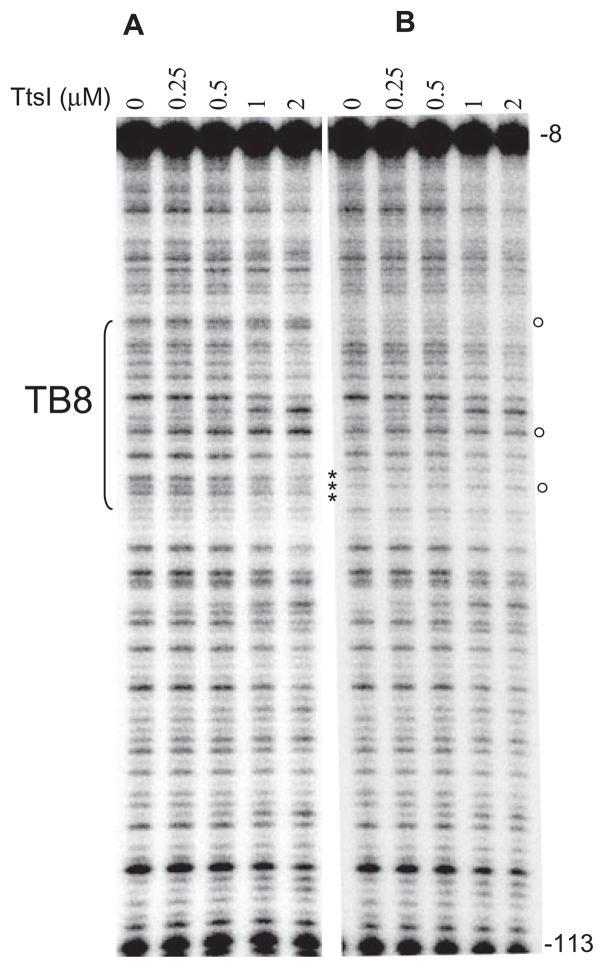
Fig. 7.
DNase I footprint of the site-directed TB8 mutant.32P-labelled PCR fragments (A, wild-type and B, site-directed mutant) were incubated with increasing concentrations of TtsI and then digested with limiting concentration of DNase I. After purification, DNA fragments were separated in a 6% sequencing gel, dried, exposed to Phosphoimager screens and scanned. Numbers on the right refer to DNA positions compared with ATG of downstream genes. Asterisks show the mutated bases; open circles highlight the differences in DNase I activity observed (as compared with the wild-type TB8).

