
Figure 4.
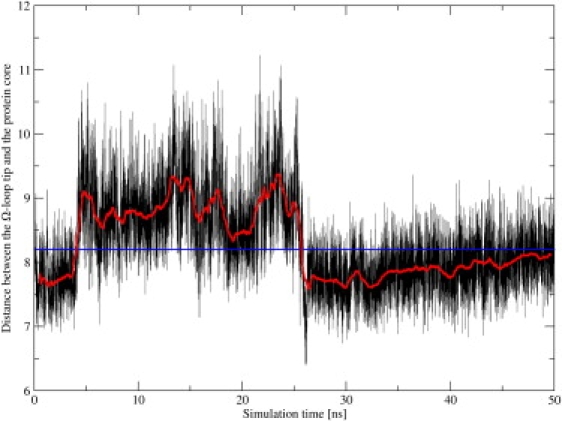
Distance between the Ω-loop tip and the residues of the protein core. Compared to the distance in the crystal structure (blue line), the distance in the extended 50-ns simulation shows an opening movement that lasts for ∼20 ns. Shown are the distance from the MD simulation sampled at 1-ps intervals (black line) and the running average over 1 ns (red line).