


Figure 2.
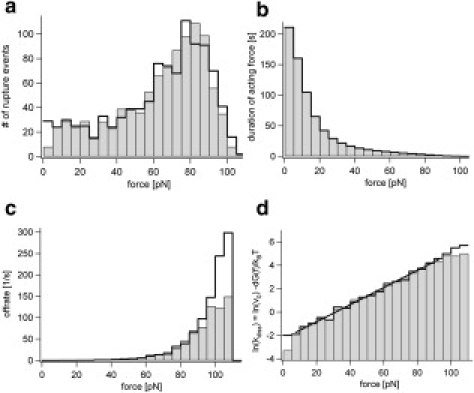
(a) Force histogram of ruptures of the simulated and analyzed data shown as black cityscape and gray histogram, respectively. (b) Total times of acting forces. (c) Calculated dissociation rates. (d) Logarithm of the dissociation rate which is a direct measure of force-dependent dissociation free energy ln(kdiss(f)) = ln(ν0) − ΔG(f)/kBT with a linear fit to the analyzed values.