
Figure 1.
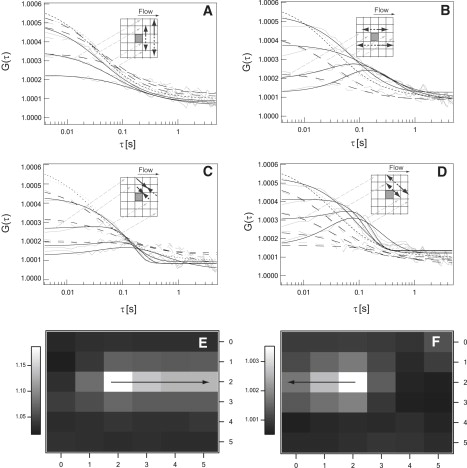
CCFs of 3 × 3 binned regions for a labeled supported lipid bilayer that was moved horizontally by 10 μm/s with the mechanical stage and thus exhibits diffusion and horizontal flow. Graphs A–D show forward (black solid line) and backward (black dashed line) CCFs that are fitted to the data (gray lines). (A) CCF along the vertical direction. (B) CCF along the horizontal direction. (C) CCF along the trailing diagonal. (D) CCF along the leading diagonal. The different solid and dashed black lines are fits to the correlations of the center pixel with different pixels of increasing distances along the indicated directions. The maps in E and F show the values of the maxima of the CCF between the center pixel and the surrounding pixels for flow only. Map E represents the values for flow along the horizontal +x direction. Map F represents the values for flow along the horizontal −x direction.