
Figure 3.
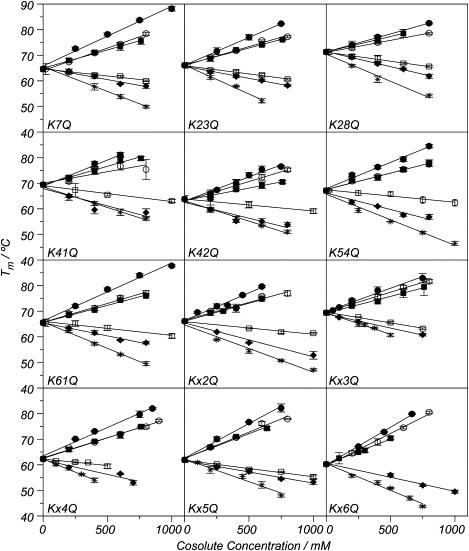
Dependence of the denaturation midpoint temperature (Tm) on the cosolute concentration. The lines correspond to the linear regression of the data for sulfate (solid circles), phosphate (open circles), fluoride (solid squares), nitrate (open squares), perchlorate (solid diamonds), and thiocyanate (stars). The error bars correspond to the standard deviation obtained from at least four independent measurements.