
Figure 4.
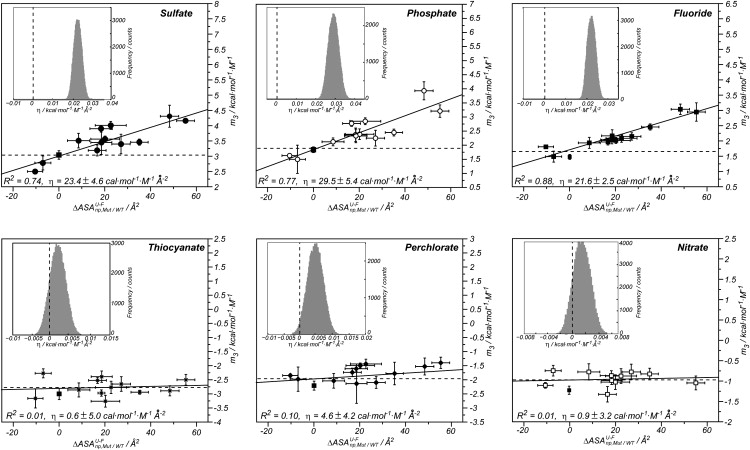
Dependence of m3 on the change in nonpolar surface introduced with the mutation () for sulfate (solid circles), phosphate (open circles), fluoride (solid squares), nitrate (open squares), perchlorate (solid diamonds), and thiocyanate (stars). The error bars for the m3 values correspond to the standard deviation of the slopes in a plot of versus the cosolute concentration, and R2 corresponds to the coefficient of determination. The slope for the wild-type is shown as a solid square in each panel. (Insets) Gaussian distributions of η values (η =) obtained from Monte Carlo propagation of the error from experimental data. Dashed vertical line highlights the value of η = 0.