
Figure 1.
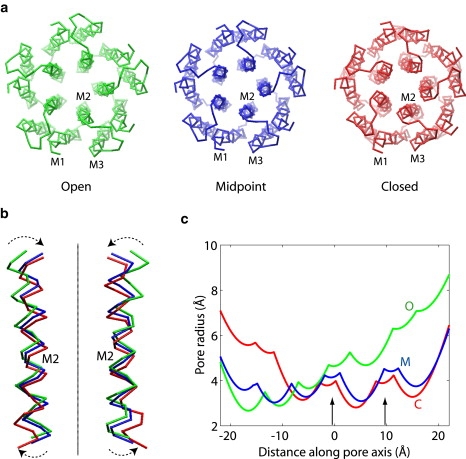
Comparison of the closed, open, and midpoint conformations in the transition path. (a) Top view from the extracellular side. The helices in one of the subunits are labeled. (b) Close-up view of two M2 helices with the extracellular side up. The line represents the symmetry axis (or the pore axis) of the protein. The arrows indicate the tilting motion of M2 during the open-to-closed transition. Molecular images were rendered in VMD (49). (c) Pore radius along its axis, calculated from the Cα coordinates using the program HOLE (42). The pore axis points from the intracellular side on the left to the extracellular side on the right. The two arrows indicate the hydrophobic region of the pore that serves as the gate for ion blockage.