
Figure 6.
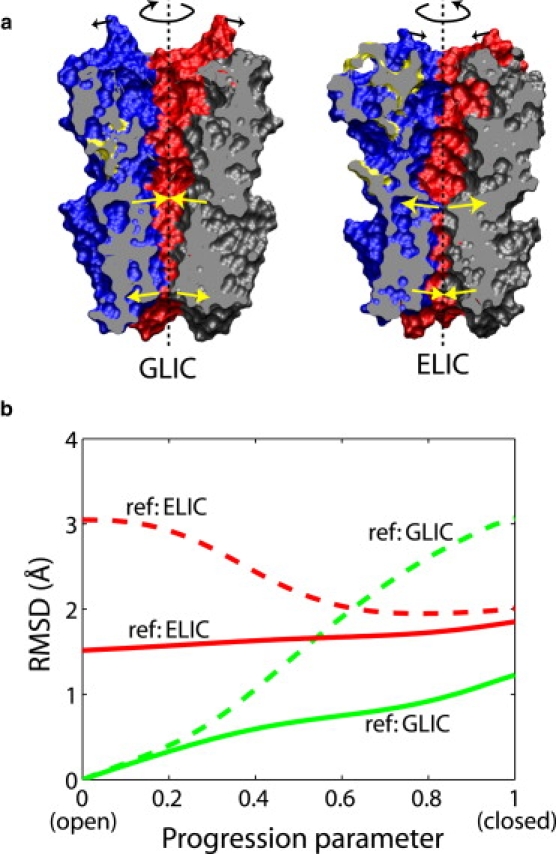
(a) Crystal structures of GLIC (6) and ELIC (5) in open and closed conformations, respectively, consisting of the extracellular domain (ECD, upper part) and the transmembrane domain (TMD, lower part). The TMDs of the two structures are aligned. Each subunit is drawn in a unique color. The proteins are cut through by a clipping plane that passes through the symmetry axis (dashed lines). The arrows indicate schematically the motions involved in the closing or opening transition, revealed by the ENM/MENM models explained in the text, including a twisting rotation of the entire ECD, a tilting motion of some helices in the TMD, and a minor tilt of the ECD subunits. Molecular images were rendered in VMD (49). (b) Analysis of the open-to-closed transition in GLIC. The RMSDs of the ECD between each snapshot in the transition path and the GLIC (6) or ELIC (5) crystal structure are plotted. The dashed lines show the RMSD values of the ECD when the TMD is superimposed against the crystal structure, and the solid lines represent the RMSDs after superimposing the ECD and thus eliminating the relative motion between the ECD and TMD. Residues constituting the common core (7) of the ECD are used for calculating the RMSD or superimposition with respect to the ELIC crystal structure.