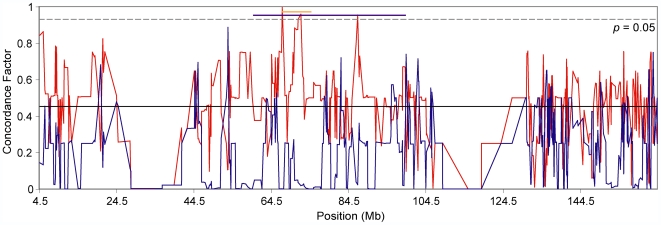
Figure 6. Sliding window analysis of discordance across the X chromosome.
Discordance within a four-locus sliding window was calculated across the X chromosome and is plotted as the midpoint position of each window. The M. m. musculus/M. m. castaneus topology (red) shows significantly higher regions along the X chromosome where known hybrid male sterility loci are mapped (Hstx1) [46]. The M. m. musculus/M. m. domesticus topology (blue) decreases within these regions. The entire Hstx1 interval is indicated by the purple line, whereas the peak of this quantitative trait locus is indicated by the orange line. The black line indicates the chromosome-wide concordance factor for the M. m. musculus/M. m. castaneus topology (0.450).

