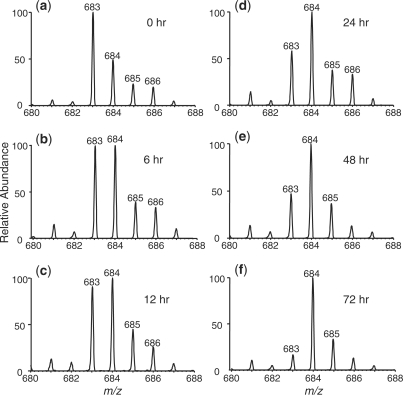
Figure 2.
High-resolution ‘zoom-scan’ ESI-MS for monitoring the kinetics of deamination of 5-methylcytosine glycol in a 27-mer duplex DNA. Shown are the regions of the mass spectra for the [M – H]– ions of the dinucleotide p(mdCg)pdG (m/z 683) and its deaminated counterpart, pTgpdG (m/z 684) at 0 (a), 6 (b), 12 (c), 24 (d), 48 (e), and 72 h (f) after the initiation of the deamination reaction, and the spectra were averaged from the two major peaks found in Figure 1a and c. The 27-mer duplex sequence and deamination reaction conditions were described in ‘Materials and Methods’ section, and the initial extent of deamination was estimated to be ∼20%.

