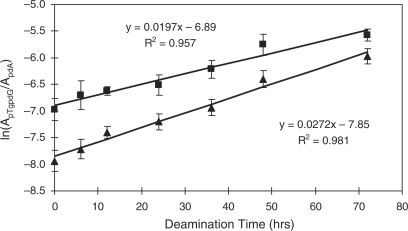
Figure 3.
Determination of the first-order rate constants for the deamination of 5-methylcytosine glycol in a 27-mer duplex DNA. Plotted are the ratios of peak area found in the SIC for the m/z 684 →541 transition (for pTgpdG) over that found in the SIC for monitoring the fragmentation of the ion of m/z 330 (for pdA) versus the deamination time. The solid square and triangle represent the results based on the formation of pTgpdG containing the (5R,6S) (the 19.5-min peak in Figure 1d) and (5S,6R) (the 20.1-min peak in Figure 1d) diastereomers of Tg (Scheme 1), respectively. The deamination reaction conditions were described in ‘Materials and Methods’ section.

