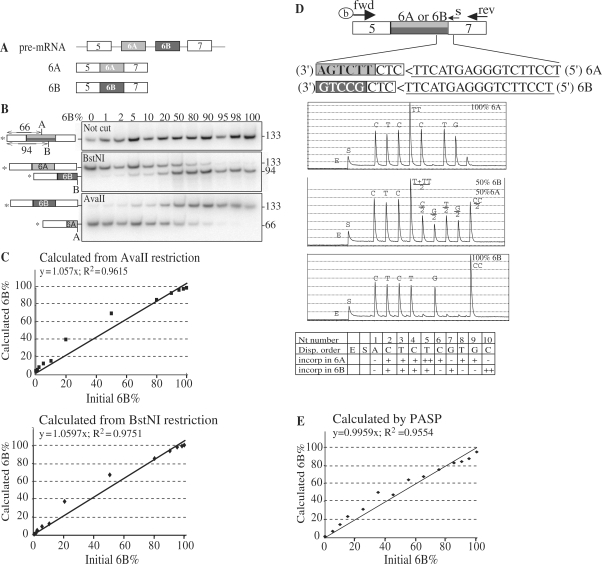
Figure 2.
Comparison of radioactive and PASP methods to analyse splicing patterns of two mutually exclusive exons. (A) Schematic of Xenopus α-tropomyosin pre-mRNA and the two alternative mature isoforms (6A and 6B). Exons are represented by boxes and introns by lines. (B) RNAs containing either the exon 6A or the exon 6B of Xenopus α-tropomyosin were obtained by in vitro transcription and mixed in the indicated proportions (6B%). In all mixes, the total amount of RNA was 1 ng. RNAs were reverse-transcribed using random primers and PCR-amplified using a radiolabelled (as indicated by the star) forward primer complementary to exon 5 and a reverse primer complementary to exon 7. One-third of the PCR products was electrophoresed in a native acrylamide gel (upper panel), and the other two-thirds were digested by either BstNI or AvaII before electrophoresis (middle and lower panels, respectively). On the sides of the gels are indicated the positions of the restriction sites BstNI (B, in exon 6B) and AvaII (A, in exon 6A) as well as the sizes of the radiolabelled restriction fragments. (C) The percentages of exon 6B calculated from the proportion of DNA left intact after AvaII restriction (upper panel) or cut by BstNI (lower panel) were plotted versus the proportion of exon 6B in the initial RNA mixture. (D) Positions of the biotinylated forward (fwd), reverse (rev) and sequencing (s) primers used for PASP of α-tropomyosin. Exons 6A and 6B are in light and dark grey, respectively. Inverse complementary of the sequencing primer is underlined (note that 5′–3′ orientation is from right to left). Boxed CTC is a trinucleotide that is present in both 6A and 6B PCR products and is immediately downstream of the sequencing primer. Three representative pyrograms corresponding to the indicated proportions of 6A and 6B RNA are shown with the nucleotide (Nt) dispensation order. E and S stand for enzyme and substrate, respectively. (E) One nanogram of total RNA containing various proportions of 6A and 6B isoforms was reverse transcribed, PCR amplified for 35 cycles, and submitted to PASP analysis. The proportions of exon 6B calculated from the ratios of peak heights in pyrograms [100 × G7/(G7 + G9)] were plotted versus the proportions of exon 6B in the initial RNA mixture.

