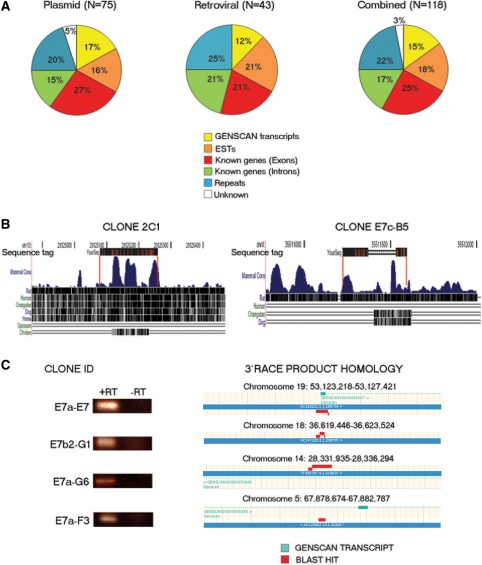
Figure 2.
Nature of poly A trap insertions. (A) BLAST hit distribution of sequence tags derived from the plasmid vectors pEHygro2SD2ARE and pGTIV3 (left) (N = 75), the retroviral vector Gep-IV3 (middle) (N = 43) and their combination (right) (N = 118). (B) Conservation analysis of two indicative sequence tags that were not homologous to any known or predicted transcripts. Genome mapping and conservation analysis were performed using the UCSC genome browser. Red lines represent the boundaries of homology between the tag and the genome. (C) RT–PCR analysis of E14TG2a ES cells using primers designed on RACE products that are not homologous to known exons/ESTs. The trapped ES cell clone IDs that gave rise to the analyzed 3′RACE products are shown on the left. The BLAST-based genome mapping (ENSEMBL genome browser) of the RACE transcripts is also shown. RT, reverse transcriptase.

