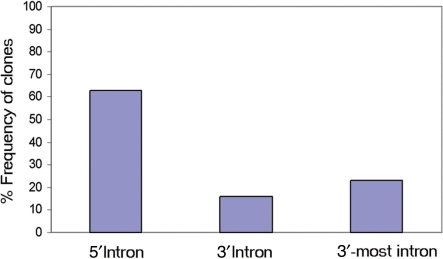
Figure 3.
Distribution of vector insertion sites within trapped genes. The analysis includes clones containing pEHygro2SD2ARE, pGTIV3 and Gep-IV3 vector integrations. Only integrations within genes with well-defined exon–intron structure were included. Insertions within two-exon genes were excluded from the analysis. The 5′- and 3′-introns were defined as being 5′ and 3′ to the middle exon or intron of a gene respectively, according to ref. (17). Vector insertions defined as ‘3’-most intron’ were independently counted and excluded from the 3′ intron group. N = 49.

