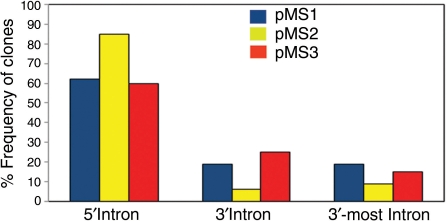
Figure 5.
Distribution of vector insertion sites within genes trapped by the β-actin promoter-containing pMS1 (blue), pMS2 (yellow) and pMS3 (red) gene trap vectors. The classification of the insertions is the same as in Figure 3. A detailed list of the pMS insertions used for the analysis is shown in Supplementary Table S5. N = 40 for pMS1 and pMS3 and N = 34 for pMS2.

