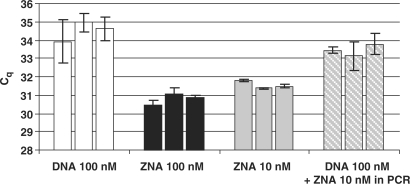
Figure 8.
ZNA primers improve the accuracy of low-abundant gene expression measurement. Quantification of HMGA2 target in three independent RT-qPCR reactions. Bars represent the Cq value for each RT reaction and error bars indicate qPCR duplicate standard deviations. cDNA was obtained by RT of 200 ng of total RNA extracted from HeLa cells using 100 nM HPRT1R and 100 nM DNA-HMGA2R (white bars, dashed bars), 100 nM ZNA-HMGA2R (black bars) or 10 nM ZNA-HMGA2R (grey bars). Each cDNA corresponding to 10 ng of total RNA was subjected to qPCR using a specific hydrolysis probe for detection. White and dashed bars represent qPCR reactions on the same cDNA samples but 10 nM of ZNA-HMGA2R primer was added in qPCR reaction represented in dashed bars.

