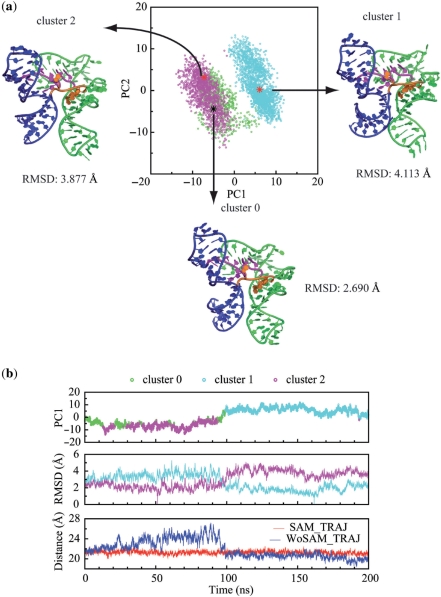
Figure 3.
Clustering and principal component analysis (PCA) point toward a chopstick-like motion involving P1 and P3 helices in the absence of SAM. (a) Projections of snapshots of the WOSAM-TRAJ are plotted against the first two principal components and color coded according to a k-means clustering (k = 3): cluster 0: green; cluster 1, cyan; cluster 2, magenta.. Representative snapshots from each cluster are also shown. This plot indicates that snapshots can be broadly clustered into two groups (cluster 1 and cluster 2) with cluster 0 representing a group with characteristics similar to those of cluster 2. The projection along PC1 broadly separates the clusters, while projection along PC2 completes the separation between clusters 0 and 2. Structures of representative snapshots indicate that clusters are distinguished by a dramatic change in relative position of P1 and P3. (b) (From top to bottom) The time evolution of the first principle component of WoSAM_TRAJ. (each snapshot is color-coded as in Figure 3a). RMSD for each snapshot in WOSAM_TRAJ relative to the representative snapshots for cluster 0 (cyan curve) and for cluster 2 (magenta curve). The distance between the Center of Mass (COM) of P1 and P3 for WOSAM_TRAJ (blue) and for SAM_TRAJ (red). During the first half of WOSAM_TRAJ, P1 and P3 helices move apart (clusters 0 and 2), then they move back together during the second half of the trajectory (cluster 1).

