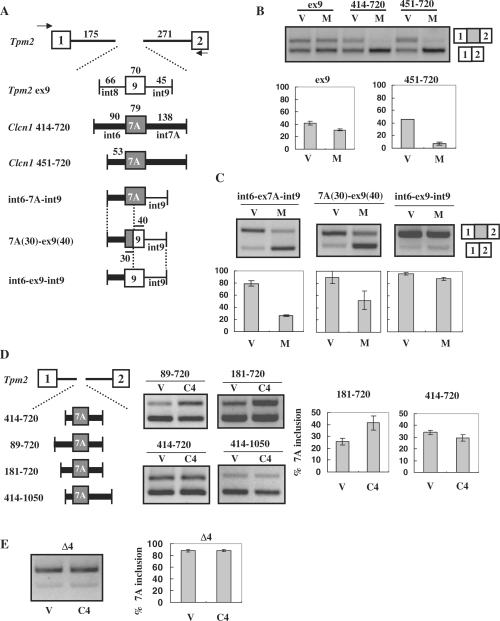
Figure 5.
Exon 7A splicing regulation in heterologous minigenes. (A) Structure of the Tpm2-based heterologous minigene. Fragments of Tpm2 covering exons 1 to 2 were inserted downstream of EGFP. Test exons together with their flanking regions were inserted into intron 1 of Tpm2. Intronic fragments derived from Clcn1 are indicated by thick lines, whereas those derived from Tpm2 (regions flanking exon 9) are indicated by thin lines. Exonic sequences of Clcn1 exon 7A and Tpm2 exon 9 are indicated by grey and white boxes, respectively. (B) Splicing assay results using Tpm2-based heterologous minigenes in COS-7 cells. Upper bands correspond to the spliced products containing an exon inserted between Tpm2 exon 1 and 2. ‘V’ and ‘M’ indicate empty vector and MBNL1, respectively. Compared with Tpm2 ex9, Clcn1-derived 414–720 and 451–720 minigenes exhibited evident responses to MBNL1. Bar chart shows quantified results of the splicing assay (n = 3). (C) Splicing regulation of heterologous minigenes containing a portion of Clcn1 intron 6. Results of the splicing assay are shown as in B. The structures of minigenes are shown in A. (D) Determination of the Clcn1 region responsible for CELF4-mediated exon 7A inclusion. Tpm2-based heterologous minigenes covering a Clcn1 region indicated by the numbers were tested for their responsiveness to CELF4 (C4). The splicing assay was performed as in B, except that CELF4 was used in place of MBNL1. In the case of 181–720, CELF4 expression induced a significant increase compared to control (P < 0.05, n = 3, two-tailed t-test). (E) Splicing analysis of the Δ4 mutant minigene and CELF4. The structure of Δ4 is described in Figure 3A. Splicing analysis results are shown as in D. CELF4 did not significantly alter the splicing of Δ4 (P = 0.97, n = 3, two-tailed t-test).

