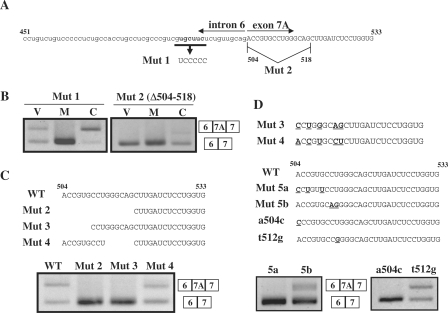
Figure 7.
Analysis of the 5′ region of exon 7A in the Clcn1 minigene. (A) Sequence of nt 451–533 of the Clcn1 minigene that corresponds to a 3′ portion of intron 6 and a 5′ portion of exon 7A. Substituted nucleotides in Mut 1 are shown in boldface. The first 15 nt of exon 7A were deleted in Mut 2. (B) Splicing assays results for Mut 1 and Mut 2 minigenes in COS-7 cells. Mut 2 exhibited a complete loss of exon 7A inclusion. (C) Effects of deletions in the 5′ region of Clcn1 exon 7A on basal-splicing efficiency. Deleted regions in Mut 2, Mut 3 and Mut 4 are indicated (upper). Splicing assay results of Mut 2/3/4/minigenes transfected into COS-7 cells are shown (lower). WT: wild type. (D) Point mutations at the 5′ end of exon 7A disrupted the basal inclusion of exon 7A. Alignment of part of Mut3 and Mut4 sequences (upper). Different nucleotides between Mut 3 and Mut 4 are indicated by boldface and underlined text. Point mutations that partly mimic the difference between Mut 3 and Mut 4 were introduced in the Mut 5a, Mut 5b, a504c and t512g mutants, as indicated by boldface and underlined text (middle). Splicing assay results of the mutant minigenes in COS-7 cells (lower).

