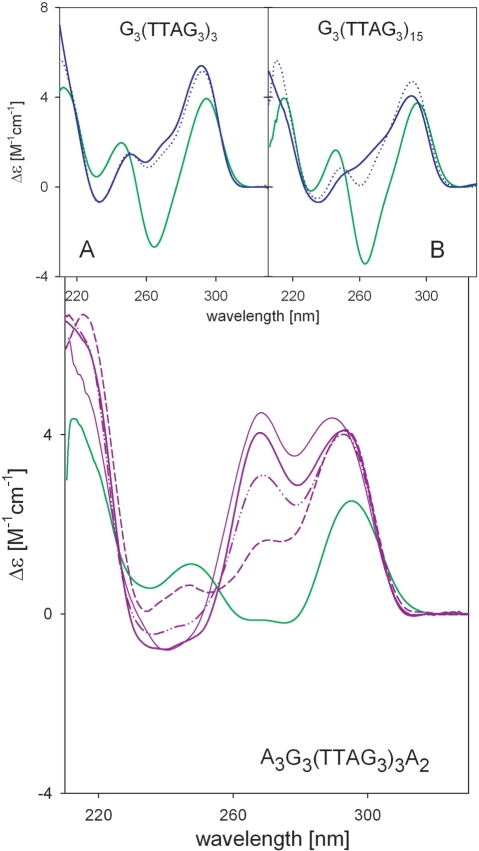
Figure 3.
CD spectra of A3G3(TTAG3)3A2 in 10 mM sodium phosphate buffer (pH 7) with 135 mM NaCl (green line) and upon addition of 30 mM K+ (violet lines) measured immediately (dashes), after 3 h (dash-dot-dot), and 1 day (thick solid line), and with 100 mM K+ after 3 days (thin solid line). Upper CD spectra are of G3(TTAG3)3 and G3(TTAG3)15 in 10 mM sodium phosphate buffer (pH 7) with 150 mM NaCl (green line) and after addition of 100 mM K+ measured immediately (blue dots) and after 3 days (blue line). CD spectra were measured in 0.1 cm cells at 0°C.

