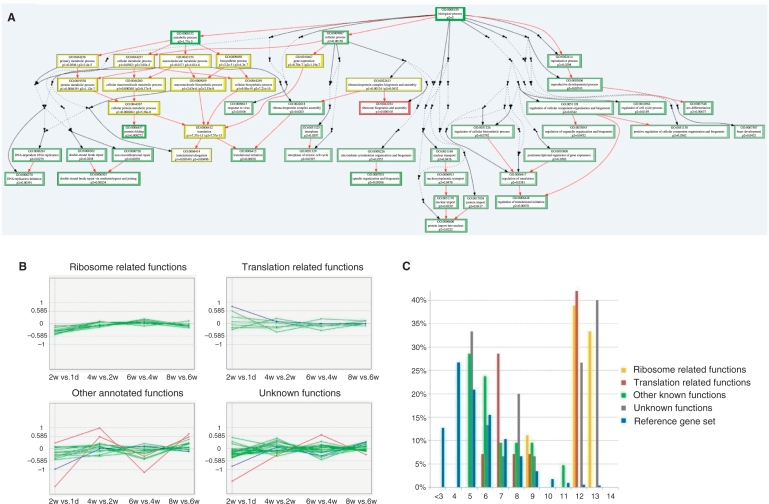
Figure 4.
Analysis of snoRNA host genes. (A) Functional analysis of snoRNA host genes according to the Biological Process category of Gene Ontology. GO terms enriched among host genes of C/D box snoRNAs and H/ACA box snoRNAs are shown as red and green boxes, respectively, and GO terms enriched among host genes of both C/D box and H/ACA box snoRNAs are shown as yellow boxes. The P-values for the enrichment of each GO term are shown within the boxes. Non-enriched GO terms in the hierarchical tree of GO terms are shown as dots to reduce the figure size. (B) Expressional changes of snoRNA host gene in chicken skeletal muscle tissue across different developmental stages. The log2 value of the expression difference between post-hatch time points 1 day, 2, 4, 6 and 8 weeks are shown. Genes with expression variance less than 1.5-fold between any two continues time points are shown as green lines, genes with expression variance larger than 1.5-fold but less than 2-fold between any two continues time points are shown as blue lines, and genes with expression variance larger than 2-fold between any two continues time points are shown as red lines. (C) Expression of snoRNA host genes in chicken skeletal muscle tissues. The log2 values of the average expression level of each snoRNA host gene across all examined time points are shown on the X-axis. The proportions of snoRNA host genes within each expression level range are shown on the Y-axis. The expression of all genes detected on the microarray is used as the reference gene set.

