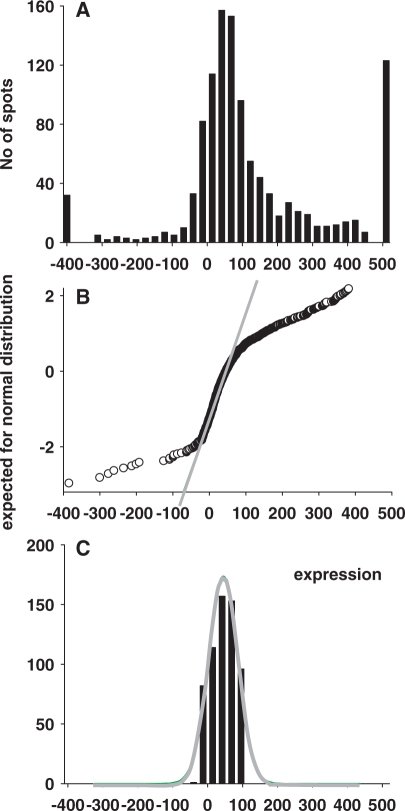
Figure 3.
Procedure of normalization of the gene expression profile. (A) The histogram of overall gene expressions fits poorly to a normal distribution, with noticeably extended left and right tails. Values at the left tail results from the background correction procedure, while values at the right tail correspond to genes expressed above background. (B) Normal probability plot demonstrates deviations from normality in the tails of the A-distribution. (C) The results of iterative removal of residual background spots demonstrate a good fit to normal distribution. This histogram is used for the estimation of the parameter of normal distribution through the non-linear least-squares curve fitting procedure. Once the parameters of the normally distributed background noise are determined, all expression data are transformed, yielding mean = 0, SD = 1 for background distribution. All gene expressions are presented now in the SD units of the background distribution.

