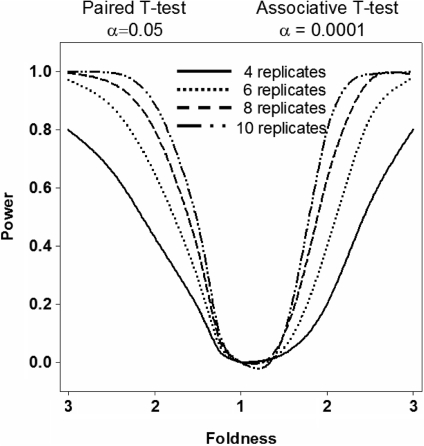
Figure 7.
Power analysis. Estimation of the number of microarray experiments required to obtain reliable results from a comparison of data from patients and controls. The sample size was estimated using PASS 2005 (Keysville, Utah). Our experience with different array technologies (including ‘Illumina’, which is used here) indicates that a coefficient of variation between 0.25 and 0.5 is typical among expressed genes. The left portion of graph demonstrates the dependence of the power of analysis on the number of replicates for a paired T-test with a statistical threshold of α = 0.05. On the right portion of the graph, power analysis results from an associative analysis are estimated. An associative analysis with threshold of α = 0.0001 has power comparable with a paired T-test using a threshold of α = 0.05. Results of this analysis will be used for estimating the number of replicate experiments required for selection of differentially expressed genes. For example 2- to 3-fold difference can be observed with power 1 − β = 0.8 with a 6-replicate experiment.

