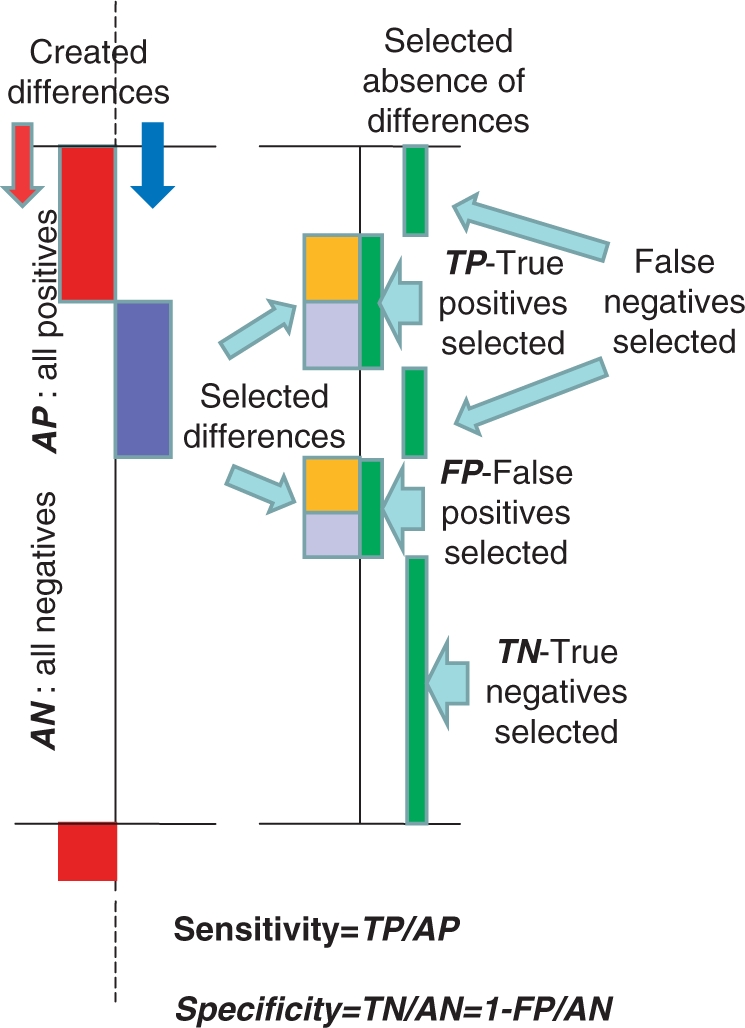
Figure 8.

Test system for determination of the sensitivity and specificity of the differential gene expression analyses. The presumingly homogeneous group of samples was divided to two equal sub-groups one of which not changed used as a control and another one used as a experimental group with introduced changes. Here is shown a fragment of these experimental dataset with introduced positive (red) and negative (blue) changes in the 20% portion of gene expression—left part. Right part presents differences selected by the differential gene expression analysis (left of the vertical axis) with indication on the right side from the axis which of this selection is true (co-incidenting with the artificially made selections) and which are false. The sensitivity of selections is determined here as a proportion of true positive selections within all produced changes, whereas a specificity determined as a proportion of true negative selections. The fragments with artificial changes presented here are evenly distributed along all experimental group.
