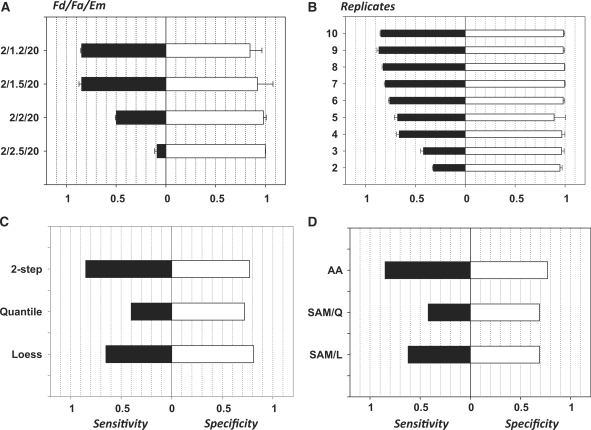
Figure 9.
Sensitivity/specificity (Sn/Sp) characteristics of the normalization and analyses procedures. (A) Dependence of the analysis quality of the foldness of changes in gene expression: along ordinates Fd-foldness of controlled changes of data/Fa-minimal foldness accepted for results of differential gene expression analysis/Em = 20-minimal expression above background. (B) Dependence of the analysis quality of the number of replicates. Fd/Fa/Em = 2/1.5/20. (C) Comparison of normalization methods: two-step analysis (presented above) versus Quantile normalization versus Lowess normalization. (D) Comparison of analysis methods: associative analysis—SAM with Quantile normalization—SAM with Loess normalization. Abscise—sensitivity and specificity of the analysis as described in text.

