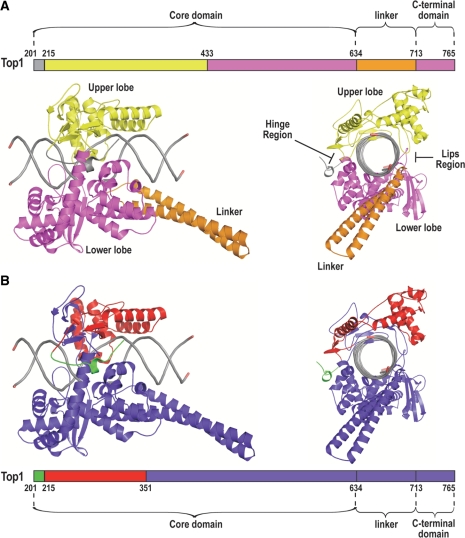
Figure 7.
Ribbon diagram of the bi-loped structure of Top1 in covalent complex with DNA viewed with the DNA axis horizontally orientated (left) or looking down the axis of the DNA (right). Diagrams are based on the X-ray crystal structure by Staker et al. (24) of a ternary complex of Top1, DNA and TPT, which provides resolution of residues 201–765. TPT is omitted for clarity. (A) Representation of upper lobe in yellow, lower lobe in magenta, the linker region in orange and the DNA in gray. The hinge region that opens and closes the enzyme around the DNA and the lips region where the upper and lower lobes interact upon DNA binding are indicated. (B) Representation of the mtDNA repressive regions (residues 201–214 and 215–351) in green and red, respectively.

