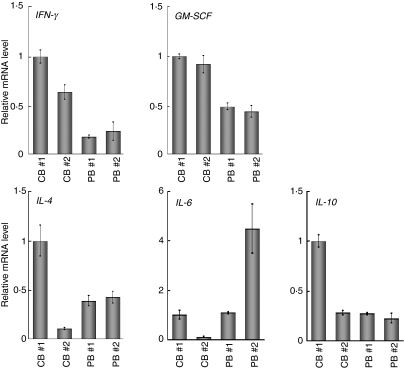
Figure 2.
Quantitative polymerase chain reaction (PCR) analysis of the genes related to the T helper type 1 (Th1) and Th2 phenotypes. The expression of the genes indicated was examined by real-time reverse transcriptase (RT)-PCR using the same sample specimens as in Fig 1. Data are normalized to the mRNA level in PB 1 which is arbitrarily set to 1. The signal intensity was normalized using that of a control housekeeping gene [the human glyceraldehyde-3-phosphate dehydrogenase (GAPDH) gene]. Data are relative values with the standard deviation (SD) for triplicate wells.

