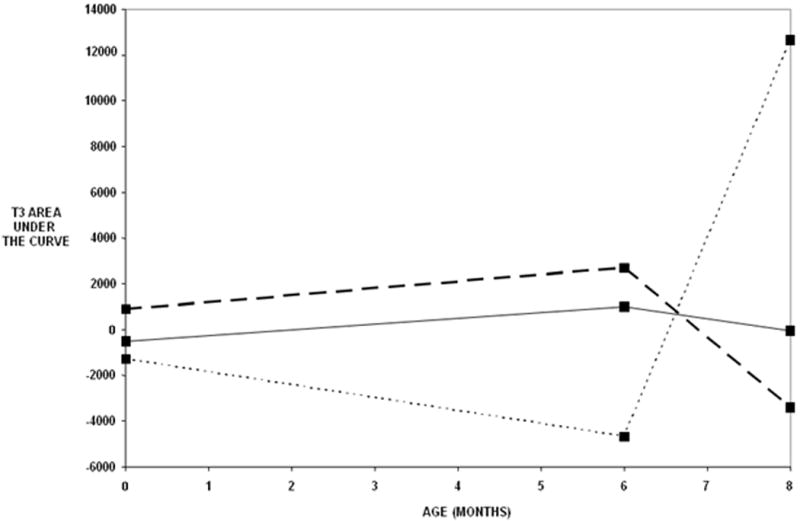
Figure 3.

Observed T3 difference wave areas under curve (stranger – mother) by risk group and age. Solid lines indicate the mean difference wave areas for the control group. Long dashed lines indicate the mean areas for the low risk IDMs and the short dotted line indicates the mean areas for the high risk IDMs. See Table 2 for statistical computations.
