
Fig. 5.
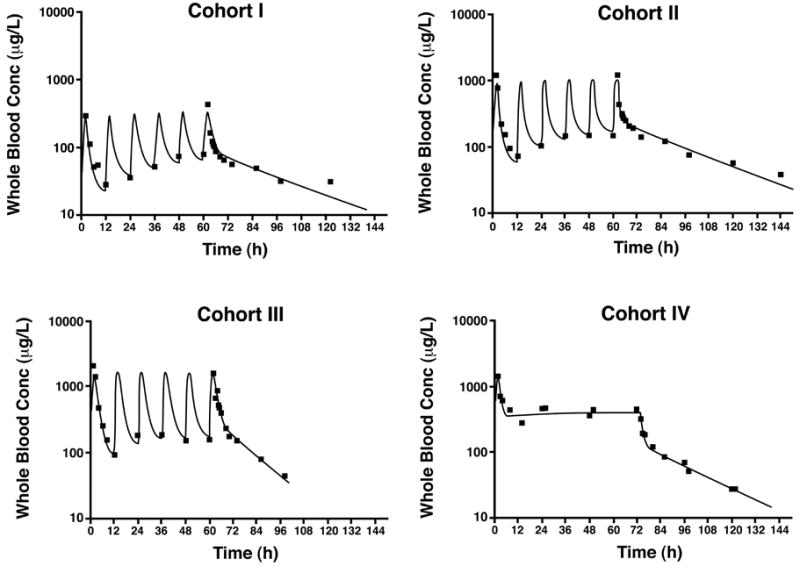
Graphs of pharmacokinetic modeling. Observed (squares) and predicted (lines) cyclosporine whole blood concentrations in a representative patient at each dosing level. (See Table 1 for the cyclosporine doses.) Conc = Concentration.
Official websites use .gov
A
.gov website belongs to an official
government organization in the United States.
Secure .gov websites use HTTPS
A lock (
) or https:// means you've safely
connected to the .gov website. Share sensitive
information only on official, secure websites.
Graphs of pharmacokinetic modeling. Observed (squares) and predicted (lines) cyclosporine whole blood concentrations in a representative patient at each dosing level. (See Table 1 for the cyclosporine doses.) Conc = Concentration.