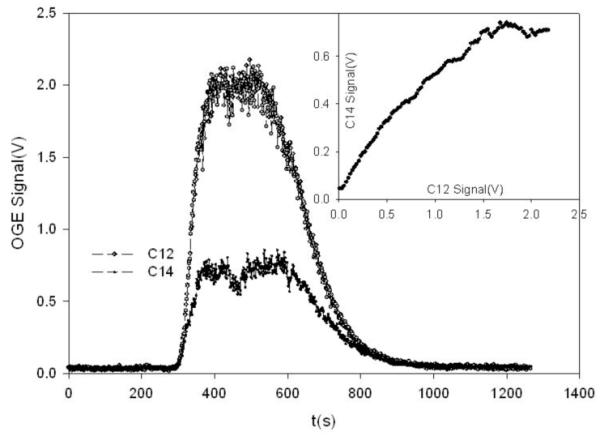
Figure 5.

Variation of OGE for 12C (top) and 14C (bottom) as 1 ml is injected into the CO2 free buffer gas flowing at 10 SCCM. As shown in the inset, the signals scale at low concentrations, but the 14C signal saturates at a much lower concentration than the 12C.
