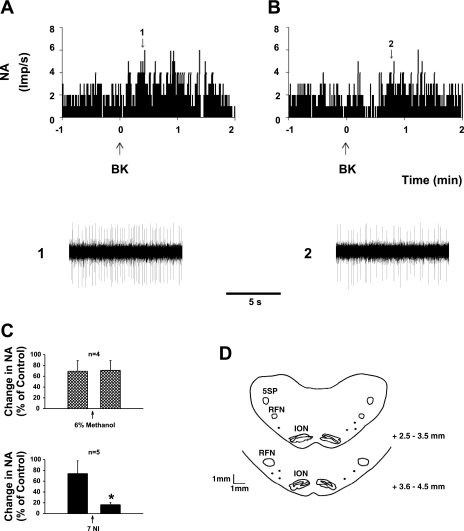
Fig. 6.
A and B: neurohistograms showing rVLM NA in response to epicardial application of BK (10 μg/ml) before (A) and after (B) iontophoresis of the nNOS inhibitor, 7-NI. 1 and 2: representative tracings of discharge activity at times indicated by the arrows above histograms. C: changes in NA of group of neurons responsive to cardiac BK stimulation before and after iontophoresis of 7-NI (bottom) or vehicle (top). *P < 0.05, compared with control before application of 7-NI. D: mapping sites of rVLM neuronal recordings in medullary planes rostral to obex.

