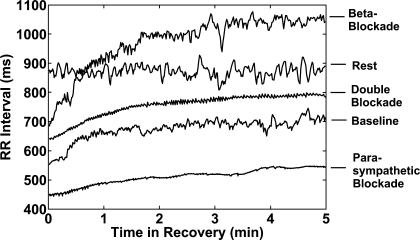
Fig. 2.
RR interval plots during preexercise rest and for the first 5 min of recovery after exercise. Significant heart rate variability is seen in the preexercise resting RR intervals. The recovery RR intervals at baseline and with β-blockade show low variability that increases with time. The RR intervals with parasympathetic blockade and double blockade have low variability throughout the 5 min of recovery.

