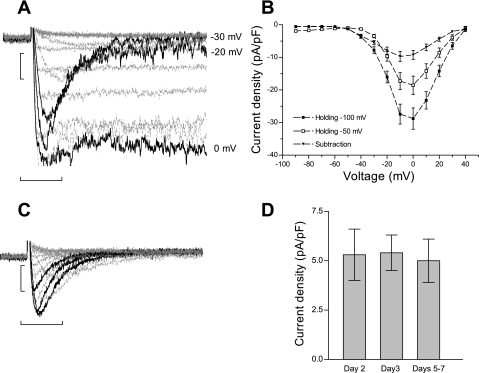
Fig. 1.
T-type current recordings in cultured neonatal rat ventricular myocytes (NRVM). A: representative traces for T-type currents recorded in 10 mM BaCl2 using the subtraction of voltage protocols from holding potentials of −100 mV and −50 mV. The black traces represent −30, −20, and 0 mV. Scale bars represent 250 pA and 50 ms. B: current-voltage relation of the maximal current amplitude vs. command voltage, for traces elicited from −100 mV (■), −50 mV (□), and the subtracted current (▾). Values are means ± SE for n = 25 myocytes maintained in culture for 2 and 3 days. C: representative traces for T-type currents recorded in 10 mM BaCl2 using the subtraction of voltage protocols in the presence of 5 μM nifedipine. The black traces represent −30, −20, and 0 mV. Scale bars represent 250 pA and 50 ms. D: bar graph of the peak current density of nifedipine-resistant current at different time points in culture. The peak currents at −20 mV are −5.3 ± 1.3 pA/pF at day 2 (n = 6; ▪), −5.4 ± 0.9 pA/pF at day 3 (n = 11; ○), and − 5.5 ± 1.2 pA/pF at days 5–7 (n = 11; ▾) in culture. Values are means ± SE.

