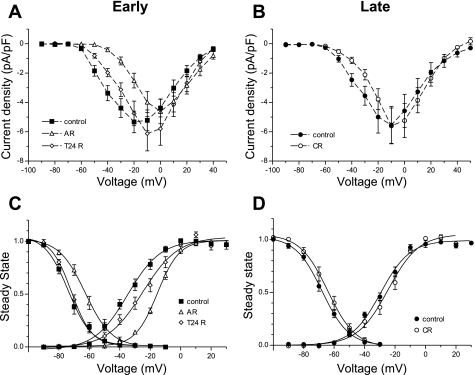
Fig. 3.
Effects of hypoxia-reoxygenation (H/R) injury on T-type currents in NRVM. Current-voltage relation is shown for T-type current densities recorded in the first hours [acute reoxygenation (AR), peak: −4.6 ± 0.8 pA/pF at 0 mV, n = 112] and after 24 h of reoxygenation (T24R; peak: −6.1 ± 1.2 pA/pF at −10 mV, n = 14) (A) and chronic reoxygenation (CR; peak: −5.6 ± 1.2 pA/pF at −10 mV, n = 19) (B), compared with control myocytes. Values are means ± SE. C and D: corresponding changes in the voltage dependence of activation and inactivation at an early (C) and late (D) time in culture. Values are means ± SE fitted with Boltzmann equation.

