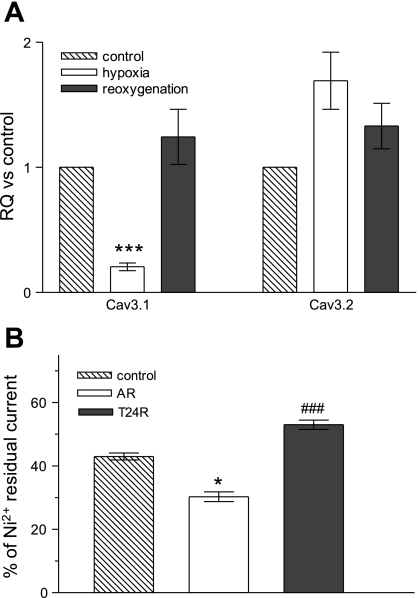
Fig. 6.
Effects of H/R injury on mRNA levels of T-type channel α-subunits in NRVM. A: bar graphs representing the relative expression of mRNA for Cav3.1 and Cav3.2 after 18–24 h of incubation in hypoxia followed by 24 h of reoxygenation. Relative quantification (RQ) was estimated based on the threshold cycle (ΔΔCT) method, using 18S rRNA as endogenous control vs. NRVM maintained in normoxic conditions for the same length of time. Values are means ± SE. B: bar graph representing the percentage of 50 μM Ni2+-resistant current out of total T-type current. Values are means ± SE for n = 10, 8, and 7 myocytes. *P < 0.05 and ***P < 0.001 calculated vs. control. ###P < 0.001 calculated vs. AR.

