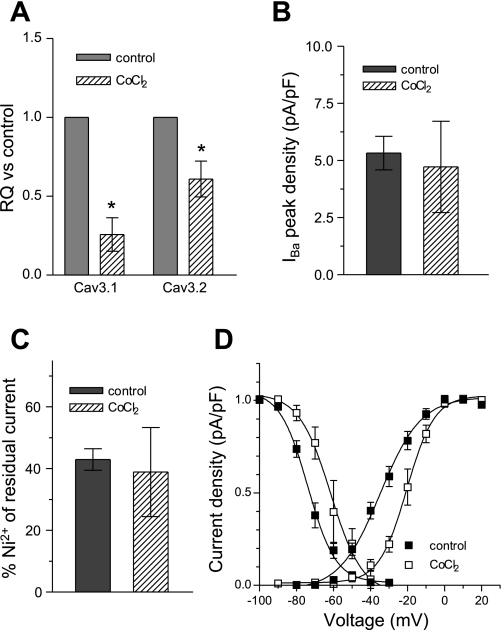
Fig. 7.
Effect of 100 μM CoCl2 on T-type current in NRVM. Bar graphs represent the changes in T-type current mRNA (A; n = 4), current density at peak (B), and the percentage of 50 μM Ni2+ residual current (C) after 48 h of 100 μM CoCl2. D: analysis of voltage dependence of activation and inactivation of T-type current in the presence of CoCl2. IBa, barium current. Values are means ± SE for 5 myocytes. *P < 0.05.

