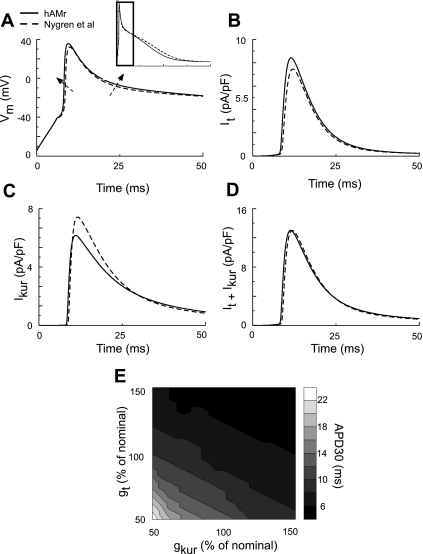
Fig. 7.
Illustration of early AP repolarization in the hAMr model and in the model of Nygren et al. (40). A: comparison of AP morphology during early repolarization in the two models. The inset shows the time course of portion of the AP examined. B and C: traces of both It and IKur during the first 50 ms of a single AP. D and E: contribution of It and IKur to early repolarization of the human atrial AP. D: sum of It and IKur, which was similar for the hAMr and Nygren et al. (40) models. E: APD30 as a function of gt and gKur; nominal values are those used in the hAMr model.

