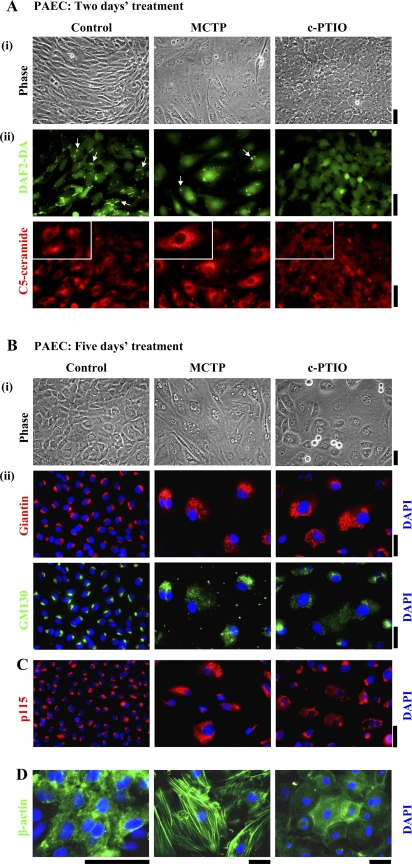
Fig. 1.
Golgi dysfunction in megalocytotic pulmonary arterial endothelial cells (PAECs) exposed to monocrotaline pyrrole (MCTP) or nitric oxide (NO) scavenging. One-day-old confluent PAEC cultures in 6-well plates were exposed to MCTP once (equivalent to ∼50 μM of active pyrrole) followed by daily replenishment with normal growth medium or to (4-carboxyphenyl)-4,4,5,5-tetramethylimidazoline-1-oxyl-3-oxide (c-PTIO; 100 μM) with daily replenishment with c-PTIO-containing medium for 2 (A), 5 (B and D), or 4 days (C). A: cultures were imaged under phase contrast (i) and switched to Arg-HBSS medium at 4°C (1 ml/well) containing BODIPY TR C5 ceramide (5 μM) for 30 min. Cultures were then washed and replenished with Arg-HBSS at 37°C for 30 min. Fifteen minutes into the latter incubation, 4–5 diaminofluorescein diacetate (DAF-2DA; 10 μM) was added and cells were imaged 15 min later using epifluorescence microscopy (DAF-2DA in the green channel and C5 ceramide in the red channel). A, ii: same fields in the two colors; scale bars = 50 μm. Insets: ×4 zoomed-in views from within the larger frame. Puncta of green DAF-2DA fluorescence seen in controls indicating surface/caveolar NO (white arrows; Ref. 43) are lost after MCTP and c-PTIO. B, C, and D: cultures were imaged under phase contrast, then fixed, permeabilized, and immunostained for the Golgi tethers/scaffolding proteins giantin and p115 (using rabbit pAbs) or GM130 (using a murine mAb), as well as for β-actin (goat pAb) and respective different secondary Abs. DAPI was used for nuclear DNA staining. B, ii: giantin and GM130 images are of same cells. In B, percentage of cells with Golgi enlargement/dispersal was as follows: controls 14.4 ± 3.6 (means ± SE over all images collected; n = 315 cells), MCTP 93.54 ± 2.4 (n = 41 cells; P < 0.001), and c-PTIO 97.6 ± 1.6 (n = 63 cells; P < 0.001). Rounded cells apparent as doublets in B, i (phase contrast) in the c-PTIO-treated culture are cells traversing through mitosis (see Figs. 8 and 9). Scale bars = 50 μm.

