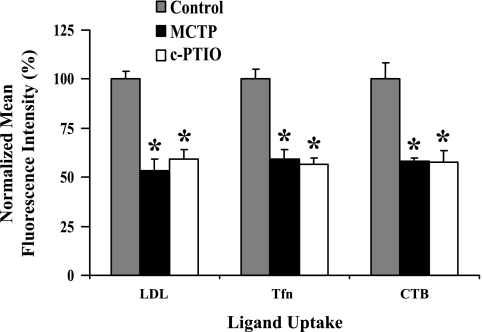
Fig. 6.
Quantitation of ligand uptake and internalization in MCTP- or c-PTIO-treated PAEC cultures. Epifluoresence imaging data such as from experiments shown in Fig. 5 and Supplemental Fig. 3 (4–20 images per variable) were quantitated in terms of fluorescence intensity per unit cell surface area, which was then normalized by taking mean values derived from control cultures to be 100 and are expressed as means ± SE over all images collected. *P = 0.001 in comparisons with the untreated control cells.

