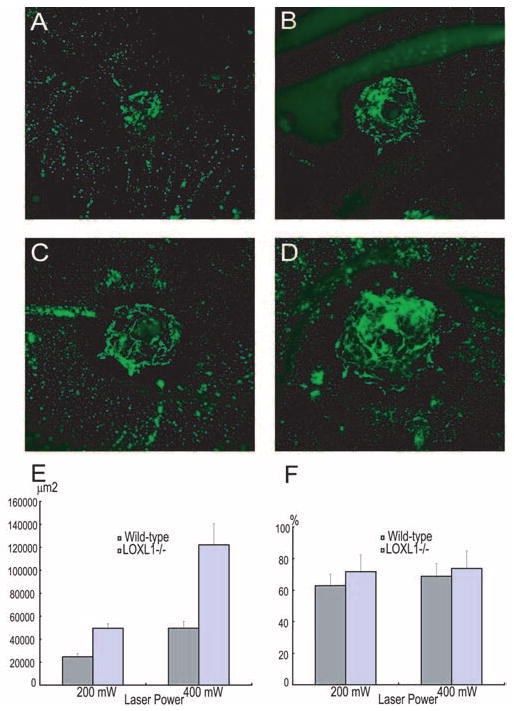
Figure 4.

Quantitation of CNV size by choroidal flat mounts. CNV lesions were larger in LOXL1-defecient mice (C, D) than in WT mice (A, B) after laser induction at 200-mW (A, C) and 400-mW (B, D) power settings. (E) Differences in CNV size are shown graphically (P < 0.01 for both power settings). The relative vascularity of lesions (F) was also determined by computer-assisted image analysis and did not differ significantly between groups.
