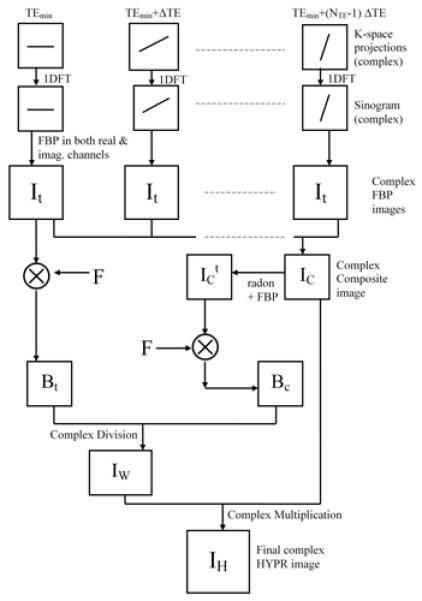
Figure 1.

Schematic Diagram of the complex HYPR LR reconstruction algorithm. For simplicity, this diagram shows the case in which all the time frames are combined to produce a complex composite image. The filtration is only applied to the magnitude channel in the formation of Bt and BC. All the boxes in the diagram are intrinsically complex-valued data.
