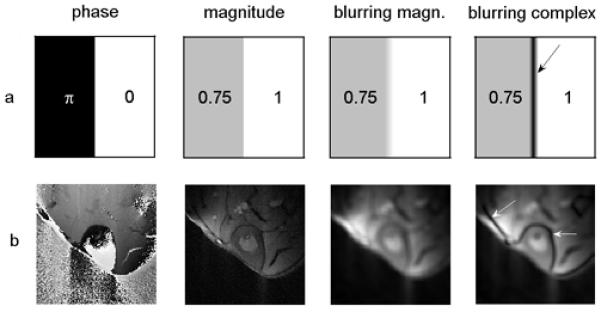
Figure 2.

A numerical phantom example (a) and an in vivo example (b) showing the band artifacts caused by filtering complex images directly. The third column shows the blurred magnitude images obtained by the proposed magnitude filtering method, while the last column corresponds to magnitude images reconstructed using the straightforward complex blurring scheme. Arrows in the last column show the typical band artifacts due to signal cancellation due to complex filtering.
