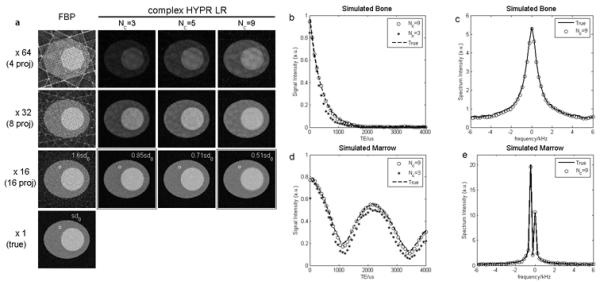
Figure 4.

Simulation results. Panel (a) shows the original image and the reconstructed images using different composite lengths at various undersampling levels. Standard deviation measured from a 100-pixel ROI is displayed for ×16 setup, and sd0 is the standard deviation measured in the actual phantom. (b) and (d) show the signal vs. TE curves from simulated bone and marrow, using two different composite lengths. (c) and (e) are the corresponding spectra of simulated bone and marrow, using composite length of 9 images.
