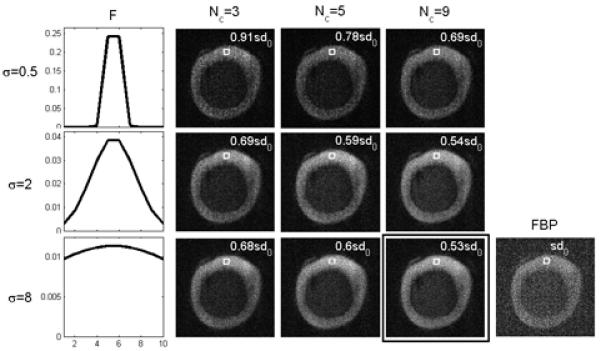
Figure 5.

Comparison of the FBP TE image and the complex HYPR LR images reconstructed using different parameters at TEmin. The first column shows the profiles of Gaussian filter kernel with size = 10 pixels with three different values of the kernel standard deviation σ. Signal standard deviation from a 100-pixel ROI was measured for each parameter setting. Images reconstructed from in vitro experiment sample #1.
