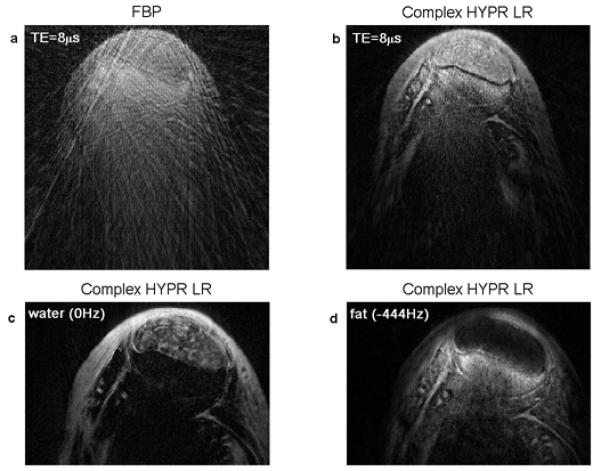
Figure 6.

Results of in-vitro experiment sample #2. Magnitude image at TE=8μs reconstructed from simple FBP algorithm (a) and complex HYPR LR method (b). Spectroscopic image at water peak (c) and fat peak (d) are also shown. Fascicular pattern inside the tensile tendon is well depicted in the water image.
