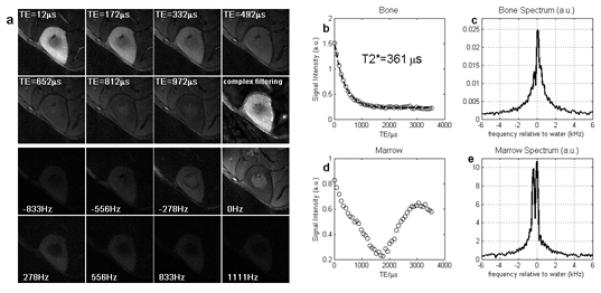
Figure 7.

Results from volunteer study. Panel (a) shows the complex HYPR LR time frames at selected TEs and the corresponding spectroscopic images at 8 selected frequencies around the water peak. The last image in the second row shows the bright ghosting artifacts if using direct complex filtering method. Graph (b) to (e) shows the signal intensity vs TE curve and the spectrum of an 8 by 8 ROI drawn from bone and marrow, respectively. Zero-padding to 512 points was performed prior to Fourier transform along the time dimension.
