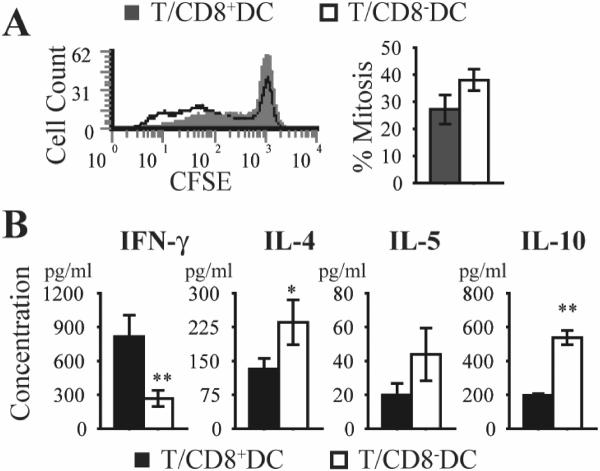
Figure 9. T cell response induced by splenic CD8+ or CD8− DC.
Purified CD8+ or CD8− splenic DC from naïve NOD mice were cultured with CD4+ T cells from BDC2.5 TCR Tg mice in the presence of peptide 1044–55 for 5 days at a 1:10 ratio A. T cell proliferation is expressed as percentage mitosis, as determined by loss of CFSE fluorescence by flow cytometric analysis. B. Supernatant cytokine production measured by Bio-Plex. **P<0.01, *P<0.05 CD8+DC vs CD8−DC.

