
Fig. 1.
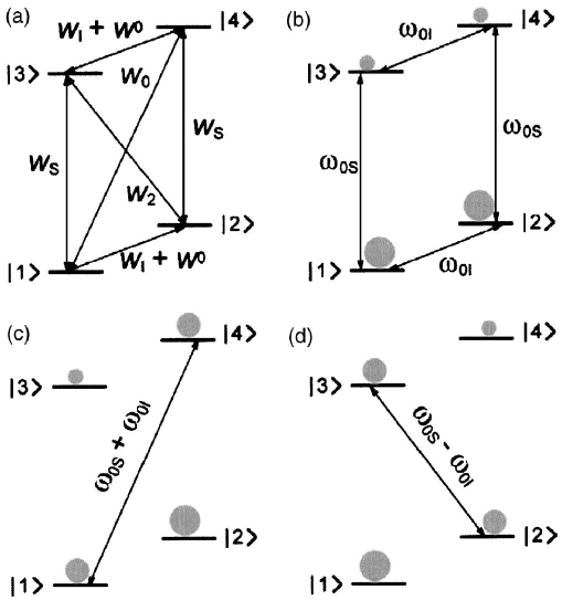
Energy level diagrams for the OE and SE. (a) Transition rates important for the OE. (b) Thermal equilibrium population for a two-level spin system. The spin population is depicted schematically in gray. [(c) and (d)] Saturation of the forbidden zero-quantum and double-quantum transitions leads to negative or positive enhancement through the SE.