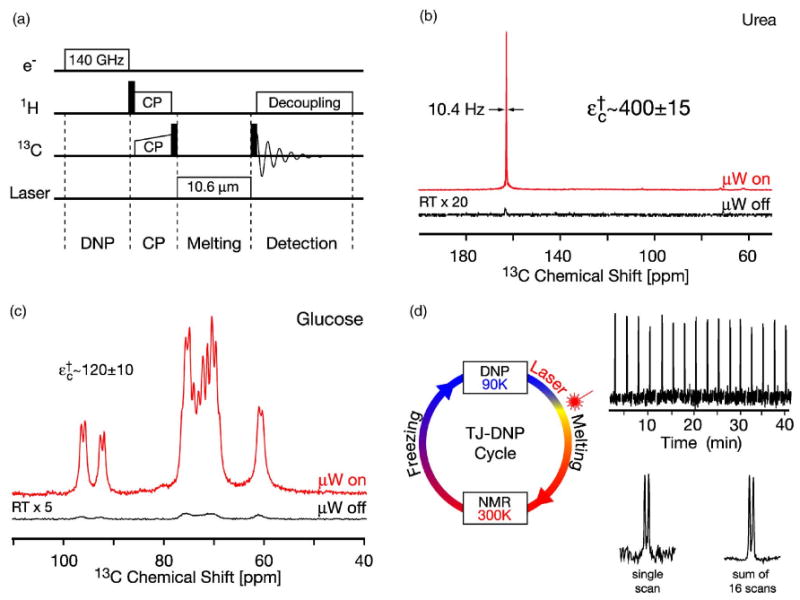
Fig. 15.

(Color online) In situ TJ-DNP experiment. (a) Pulse sequence. (b) 13C-TJ-DNP NMR spectra of 13C-urea in 50% 2H6-DMSO and 50% water (2H2O/H2O=4/1). (c) 13C-TJ-DNP NMR spectra of [U – 13C6, 2H7]-glucose in H2O. D: 16 spectra of the CO resonance in [U – 13C]-L-proline resulting from a series of TJ-DNP experiments. (Below) average of the 16 spectra giving an improved signal-to-noise ratio. Samples contained 3–5 mM TOTAPOL biradical polarizing agent corresponding to 6–10 mM electrons. The TJ-DNP spectra (the top traces in each figure) were recorded with a single scan, while the RT spectra were recorded with 256 (a) and 512 scans (b).
