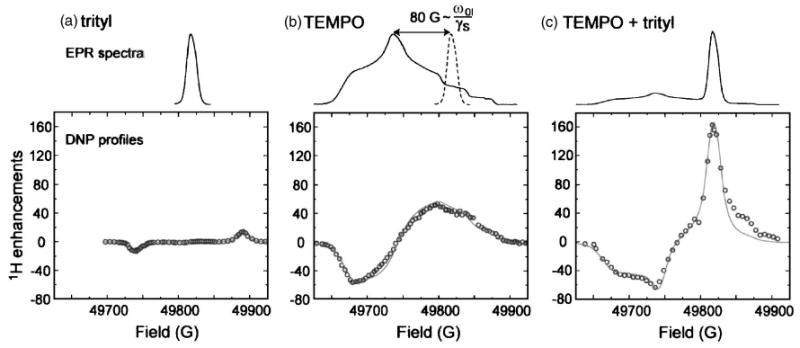
Fig. 8.

140 GHz EPR spectra and DNP field profiles for (a) trityl, (c) TEMPO, and (c) a mixture of trityl and TEMPO. The EPR spectra were recorded in 2H6-DMSO/2H2O 60:40 w/w (1 mM) at 20 K. The DNP samples were prepared in 2H6-DMSO/2H2O/H2O 60:34:6 w/w/w with a total radical concentration of 40 mM (90 K). The solid line represents a simulation of the experimental data. Figure taken from Hu et al. (Ref. 60).
